Data Embodiment | Data Sensorium
Data Sensorium 1 - Environmental Migration is a performance project that expresses migratory data through movement and graphics. The work explores environmental migration data from the Internal Displacement Monitoring Centre with the intent to raise awareness on the relationship between climate change and disaster displacement. It does this through a process of data visualization and data embodiment.
Data Sensorium is a metaLAB (at) Harvard project with seed funding from the Harvard University Center for the Environment (HUCE). The project launched in 2022 via residencies at the Harvard ArtLab and RoundAntennae. Collaborators include Isabelle Edgar (dancer) and Jordan Kruguer (choreographic interface co-developer). And advisors include KT Nelson (artistic mentor), Ilya Vidrin (dramaturg), and Hélène Benveniste (HUCE Fellow). The project has led to a peer-reviewed publication in the International Journal of Performance Arts and Digital Media. This past fall, it was shared via a presentation, performance, and workshop at Data Kinesthetics: Mapping Data to and through the Body, a symposium I co-led with Vidrin via metaLAB at the Harvard ArtLab. And currently, it can be experienced as a 2-channel video at the Honor Fraser Gallery in L.A. as part of group exhibition SMALL VO1CE curated by Jesse Damiani.

Why Data Embodiment
Given a dataset about people, humans are often enumerated as indices, understood in aggregate, and rendered as dots or areas in charts. How can this dehumanizing treatment of data inspire a humanitarian response? Through a process of data embodiment, I explore the stories that data tell in performance. For clarity, I define data embodiment as a communicative and artistic method that approaches the body as a choreographic medium to physicalize and perform abstract data. The practice fills a gap in data communication where visual, aural, and haptic media are used for data visualization, data sonification, and data physicalization respectively – the gap being the use of a kinesthetic medium for data embodiment. By personalizing data in the body and re-constituting them in time and space, especially in the context of performance, I believe sterile datasets can become more culturally communicative and accessible.

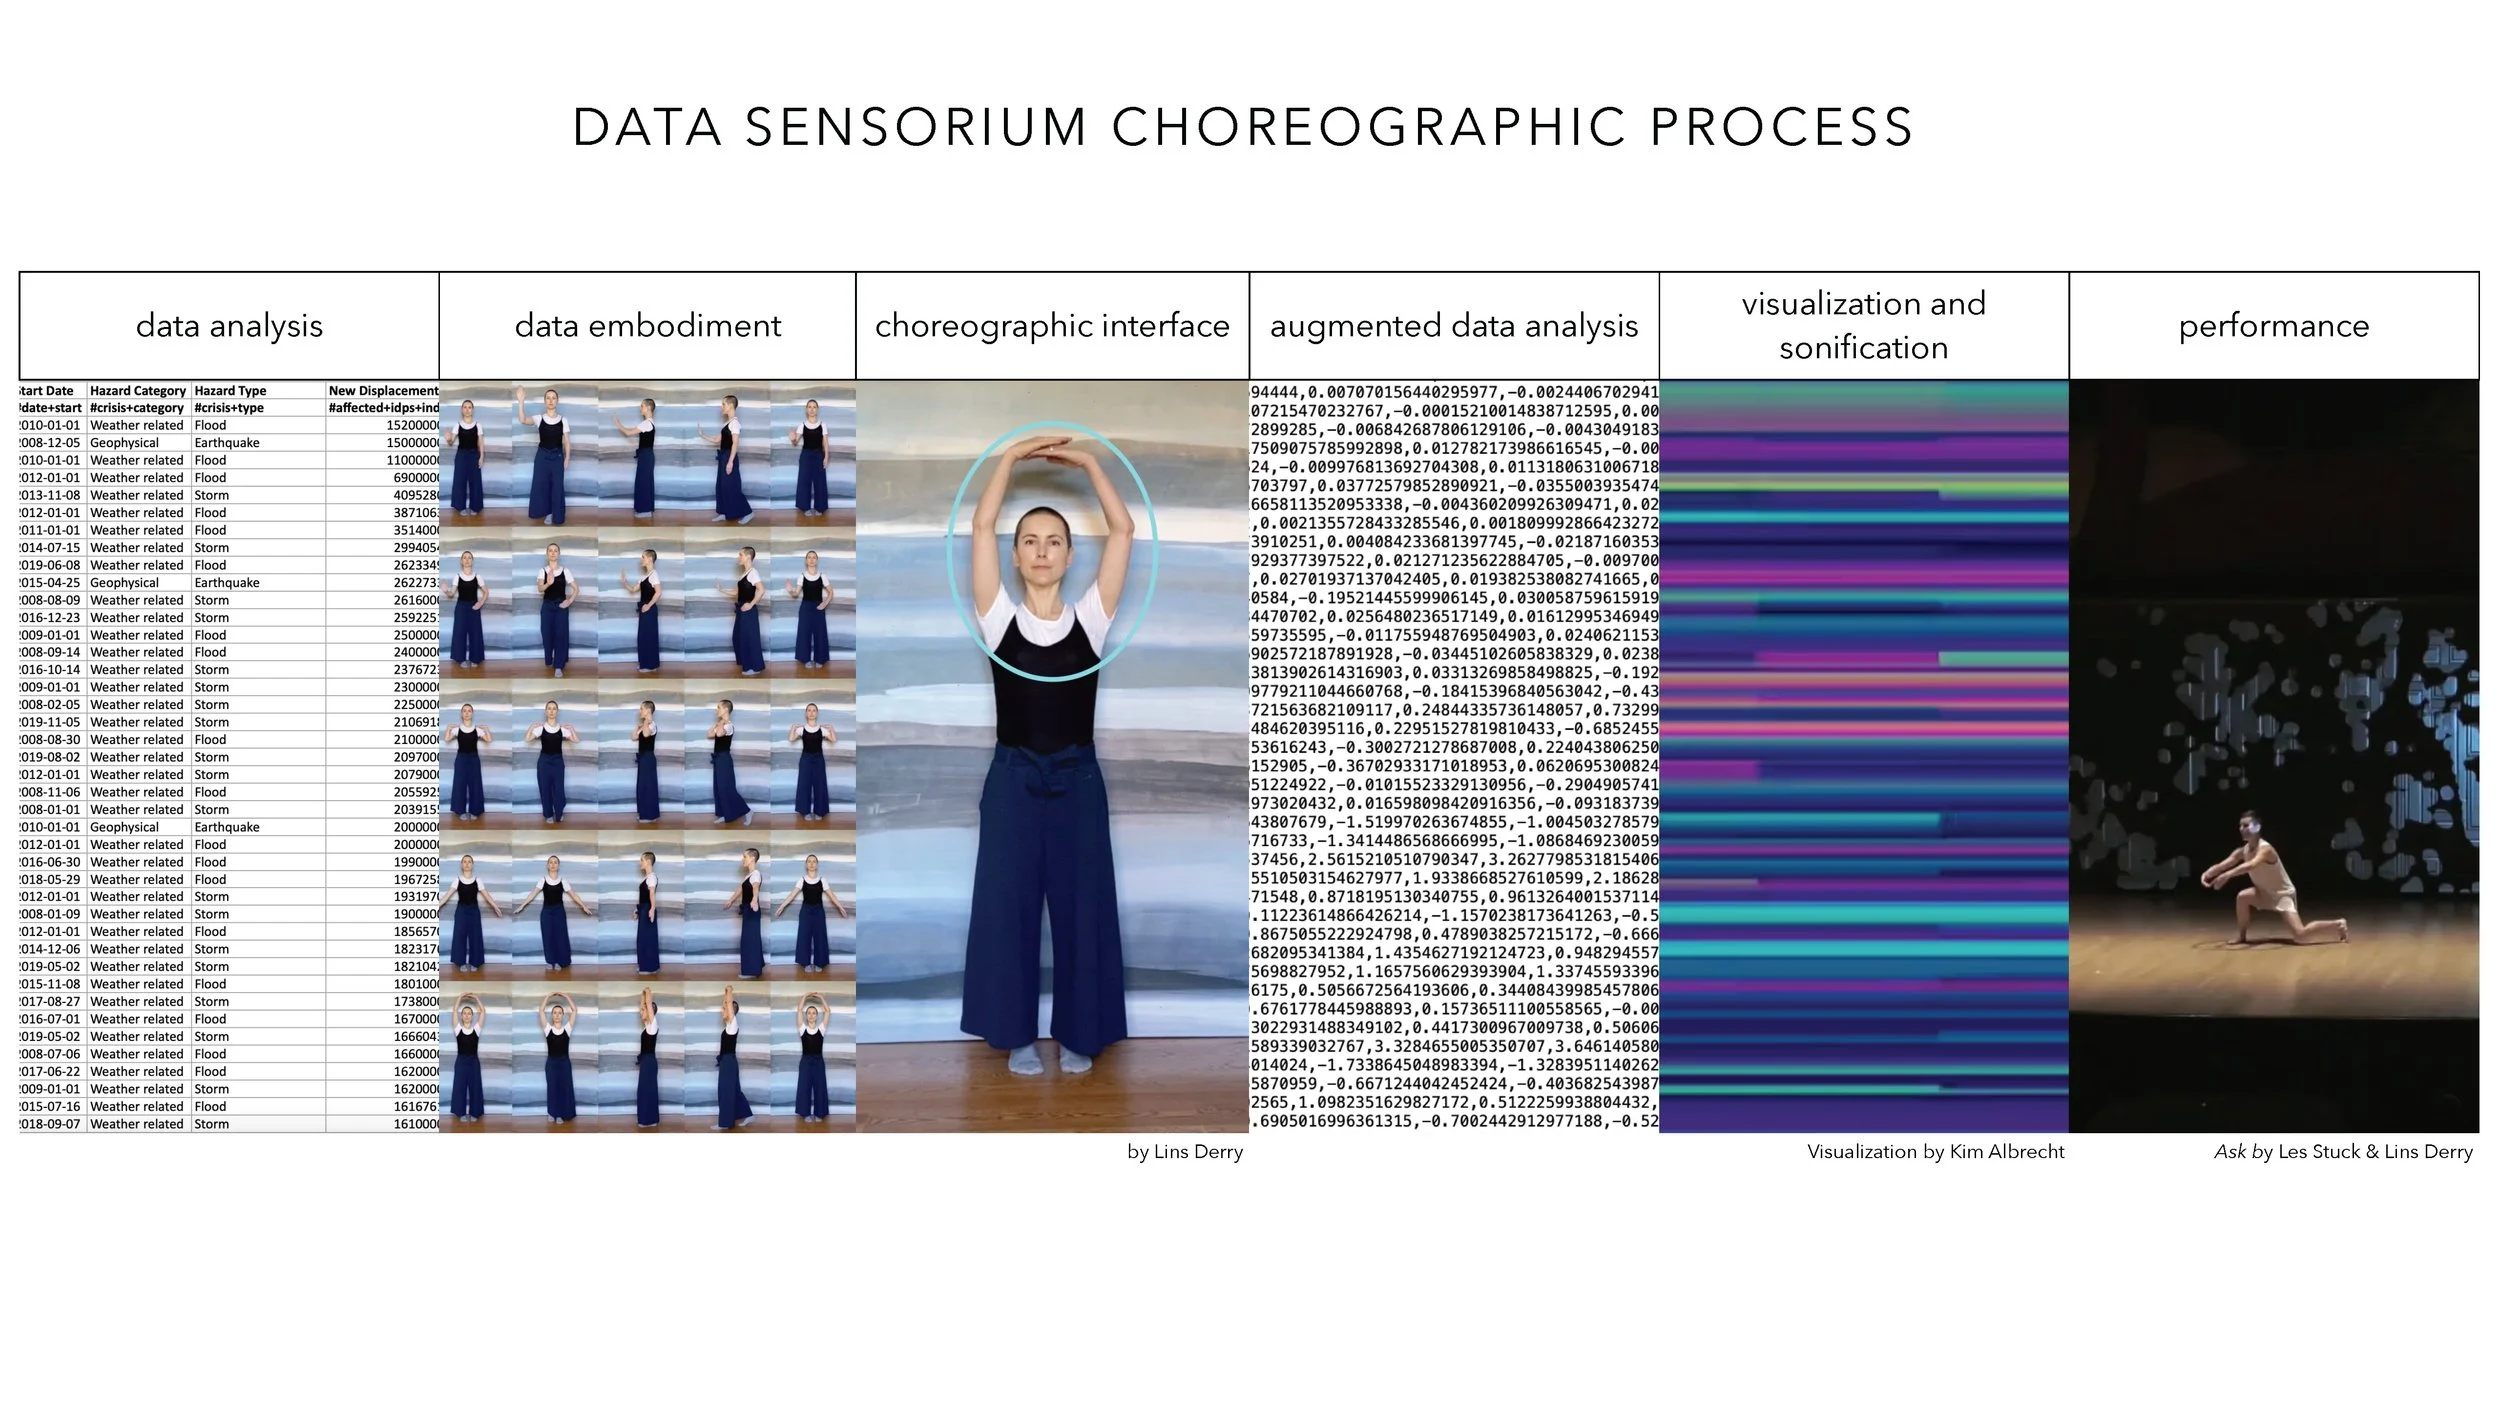
Data Sensorium choreographic process diagram.
Data Sensorium 1 - Environmental Migration
In the first iteration of Data Sensorium, I tell the harrowing story of disaster displacement in relation to climate change. The content, environmental migration accelerated by climate change, makes realizing this work urgent. In 2020, more people migrated due to environmental disasters than human war, and 30 million of those displacements were due to floods, storms, or wildfires. Data Sensorium draws attention to this important issue while simultaneously innovating data embodiment as a creative methodology in data communication and the performing arts.
In spring (2022), I began work on Data Sensorium 1 – Environmental Migration. Working with dancer Isabelle Edgar, we encoded variables as gestures and developed a movement score for progressing through the Internal Disaster Monitoring Centre data. In addition, I created a digital dashboard that reinforces the movement score with data visualizations and a choreographic interface. The visualizations were programmed in JavaScript using the d3.js library (explore the visualizations here). The interface, co-developed with Jordan Kruguer, uses machine vision and learning to recognize the gestures and provide visual feedback for supporting dance literacy. The work is currently 20 minutes long. 🔎 See the lecture-performance video at bottom! 👁
Images of the dashboard featuring the 2014 movement score for the world region Americas

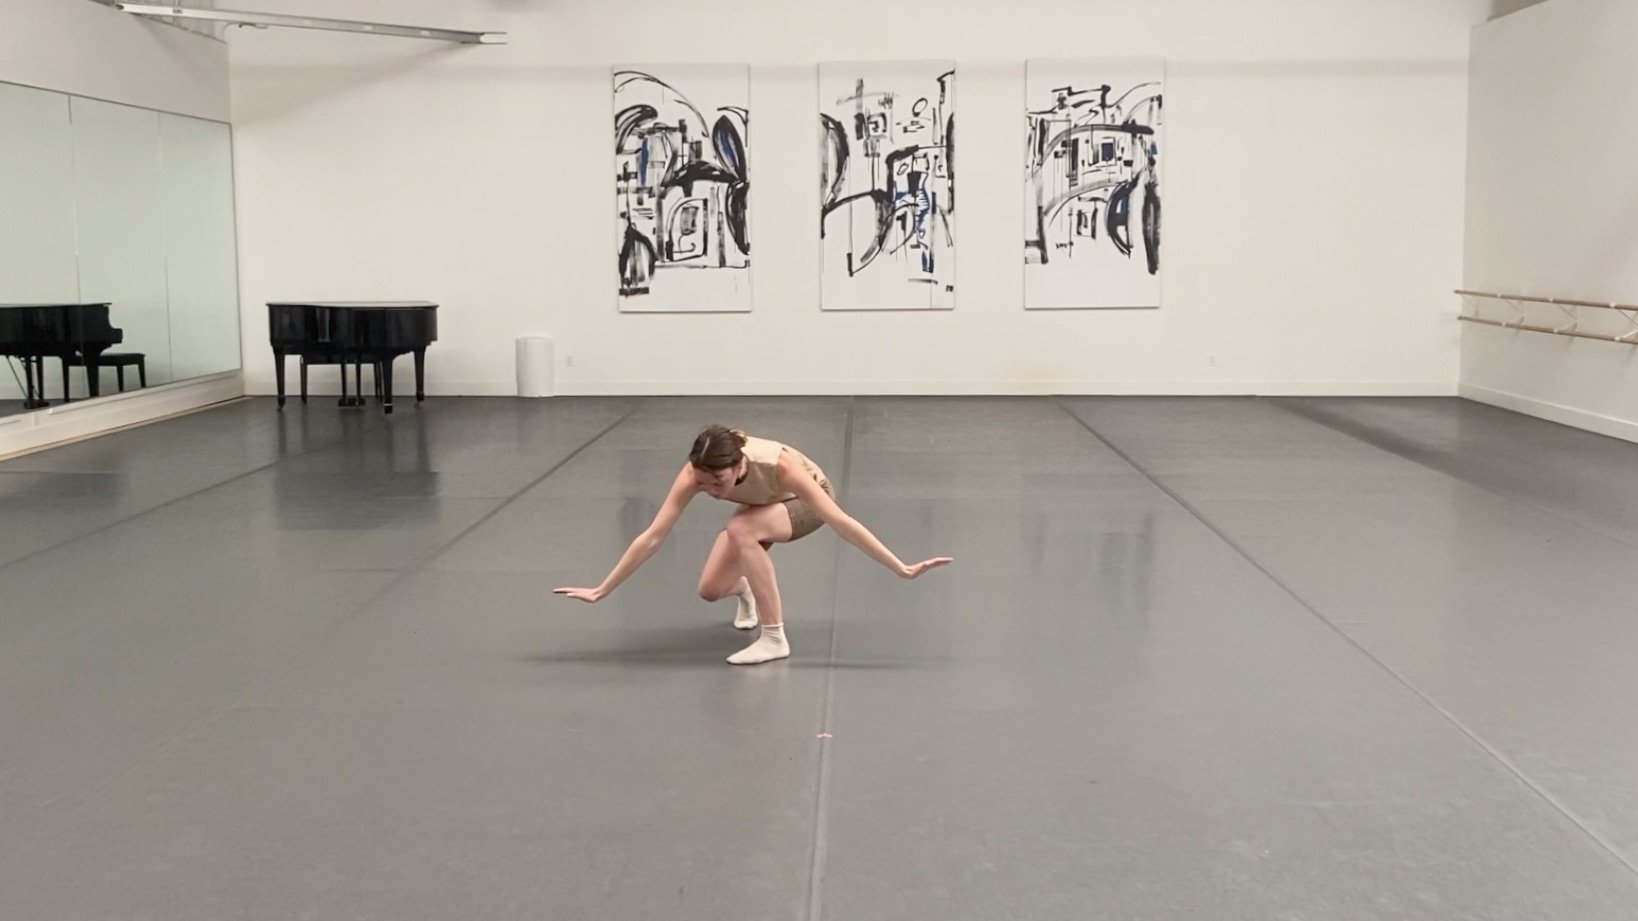
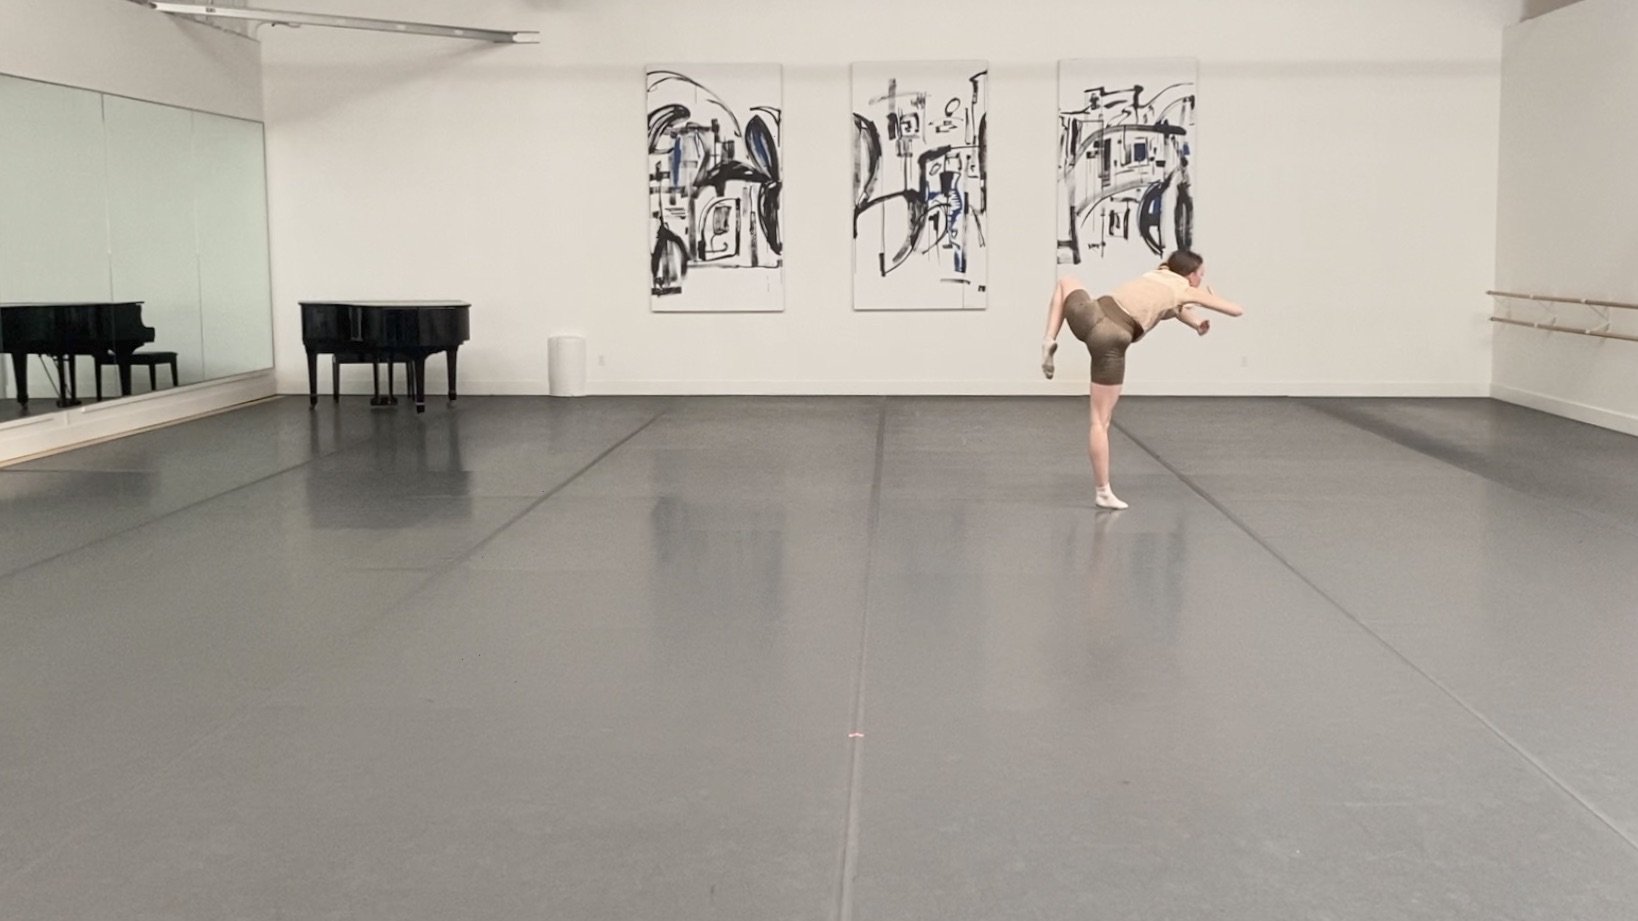
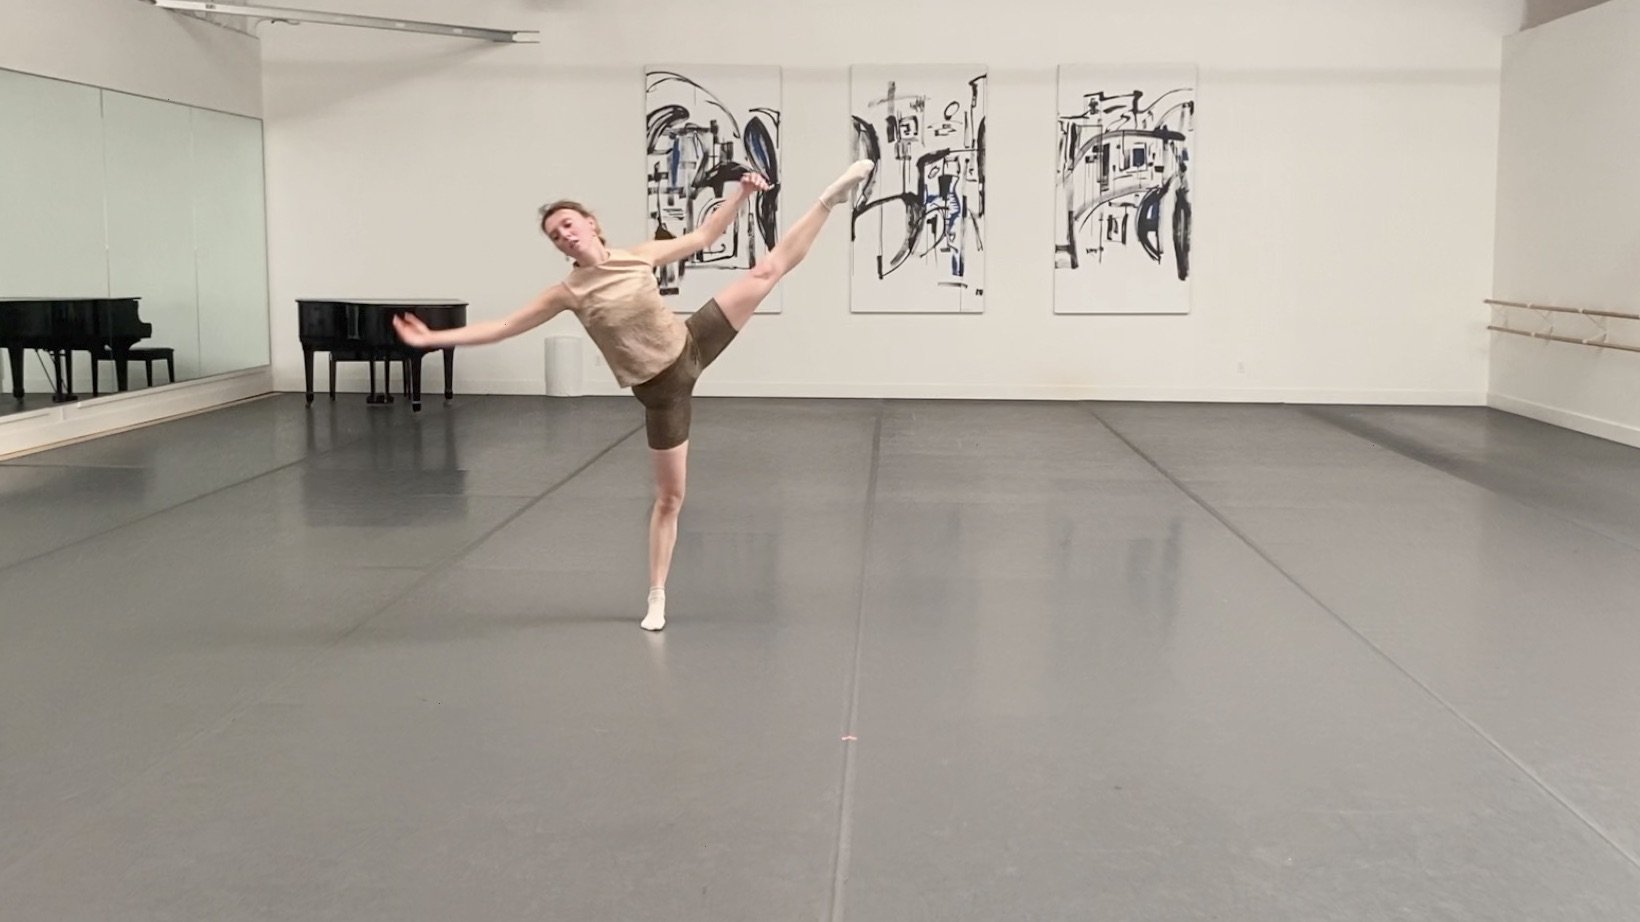
Starting clockwise from top-right is the movement score, choreographic interface, stacked area chart, and logarithmic ring chart. In the first image, the dancer, Isabelle Edgar, is on the first line of the score, performing the earthquake gesture; the corresponding chart ring and chart layer for earthquake are simultaneously isolated to match her gesture. While not shown here, as she progresses to line two, the ring and layer for flood are added. All four elements of the dashboard are color-coordinated to reveal the choreographic thinking behind the work.

In this image, Isabelle is on the last line of the score, performing the mass movement gesture, where all chart rings and layers for 2014 are highlighted.
Articles, Presentations, and Exhibitions!


SMALL V01CE. Honor Fraser Gallery, L.A.
Featuring Data Sensorium as a 2-channel video work where the visualizations/choreographic interface is stacked above the studio performance (see image above)

Data Kinesthetics: Mapping Data to and through the Body
Symposium featuring presentation and performance
“Data Embodiment: beyond the visual, back to the world”
Blog Article by Paolo Ciuccarelli

“Data embodiment: approaching the body as a choreographic medium for performing abstract data”
Research Article by Lins Derry